On this Earth Day, it seems appropriate to feature the scary but beautiful map of the world with unfrozen polar caps created by Slovakian student/graphic artist/cartographer Martin Vargic. At first glance, the map looks like a traditional nineteenth-century decorative map of the hemispheres, but then you look closer (just click on it) and see that many unshaded coastal areas are “missing” and that new seas and lakes have opened up in the midst of continental interiors: there is an Amazon Sea in the middle of South America and a new “Artesian Sea” in Australia. The map presents a rather radical vision with sea levels 260 feet higher than today (most scientists seem to project a 3 foot rise by 2100), and consequently all the coastal cities of the eastern seaboard in North America are gone (including Salem, of course), along with those of the Gulf Coast and what looks like the entire state of Florida. Across the Atlantic, London is gone, along with Amsterdam, and Denmark. Vargic, whose work can also be found here, seems to have one-upped his earlier map of the internet, which went viral earlier this year.
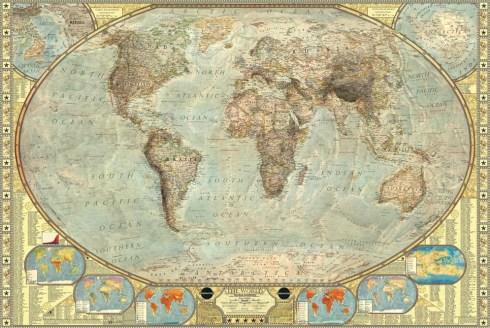


Map Images © Martin Vargic @ Halcyon Maps
Appendix: Climate maps are nothing new, although predictive ones certainly are. Those from the 17th through the 19th centuries seem to be more of the recording or empirical nature, like the circular map of London’s annual temperature cycle below. Things get a little bit more subjective later in the nineteenth and the early twentieth centuries, when “scientific racism” (and environmental determinism) tried to assert “rational” explanations for the industrial progress (and supposed superiority) of the West. The 1924 map below seems to be doing just that.


Map from Luke Howard, The Climate of London, deduced from meteorological observations, made in the Metropolis, and at various places around it…(London, 1833),Wellcome Library; and map from Ellsworth Huntingdon, Civilization and Climate (London, 1924), Wellcome Library.